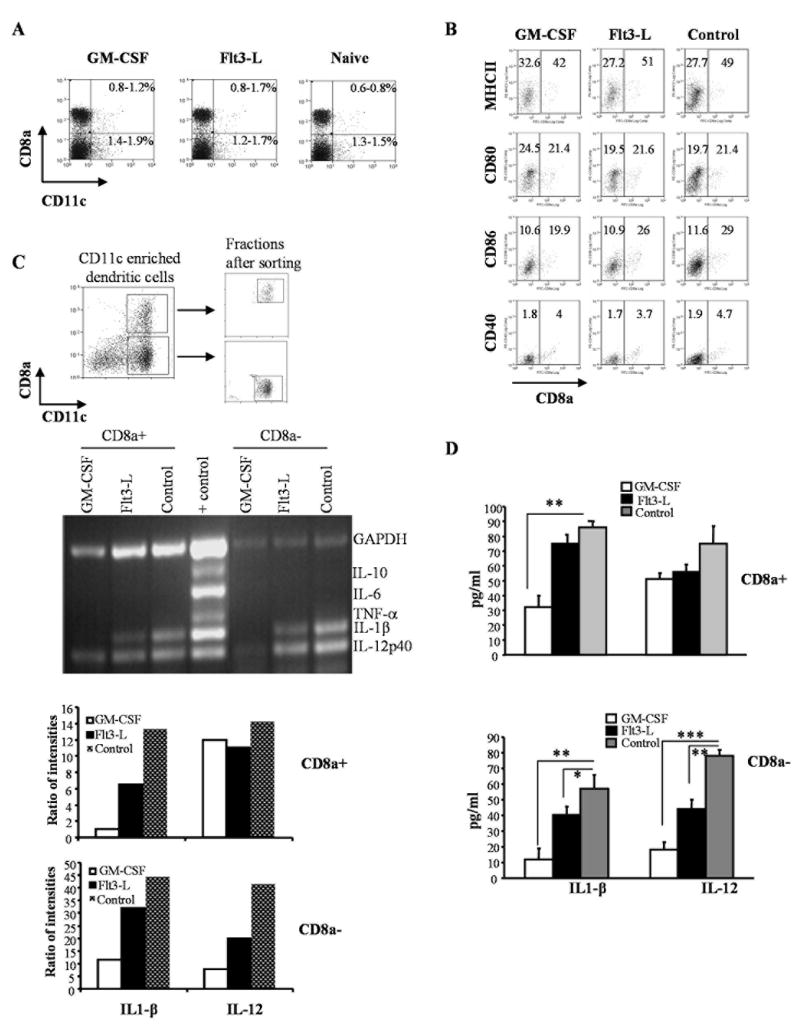
Figure 1. GM-CSF and Flt3-L treatments suppress inflammatory cytokines in both CD8a+ and CD8a- DC subsets of NOD mice.
Euglycemic female NOD mice were treated with either GM-CSF (2μg/mouse/day), Flt3-L (5μg/mouse/day) or PBS (naïve group) for 5 consecutive days starting 11 and 13 weeks of age intra-peritoneally (i.p.). A) Mice were sacrificed 48 hours after the last treatment, single cell suspension of splenocytes were stained with anti-CD8a and anti-CD11c Abs conjugated to fluorescent probes to examine for changes in the frequency of DC subsets. Percentage values of CD8a+ and CD8a- populations among total splenocytes are shown. B) Purified CD11c+ DCs were stained with fluorochrome labeled anti-CD8a and MHC-II, CD80, CD86, or CD40 Abs and analyzed by FACS. Mean fluorescence intensity values of activation marker specific staining on CD8a+ and CD8a- populations are shown. C) Purified CD11c+ DCs were stained using fluorochrome labeled anti-CD8a Ab and sorted into CD8a+ and CD8a- DCs using a cell sorter. Dot plots show the gating pattern for the isolation of CD8a+ and CD8a- DCs from enriched CD11c+ DCs (upper panels). RNA samples prepared from CD8a+ and CD8a- DC subsets were used in a multiplex RT-PCR assay to detect relative levels of cytokine transcripts (middle). Relative densitometry values of individual bands are plotted as bar diagrams (lower panels). D) Purified CD8a+ or CD8a- DCs were cultured (1×10⁶ cells/ml) for 48h and supernatants were tested for secreted levels of IL-1β and IL-12 by ELISA. Mean + SD values from three independent assays carried out in triplicate are shown. *** represents p<0.001, ** represents p < 0.01. * represents p<0.05.

