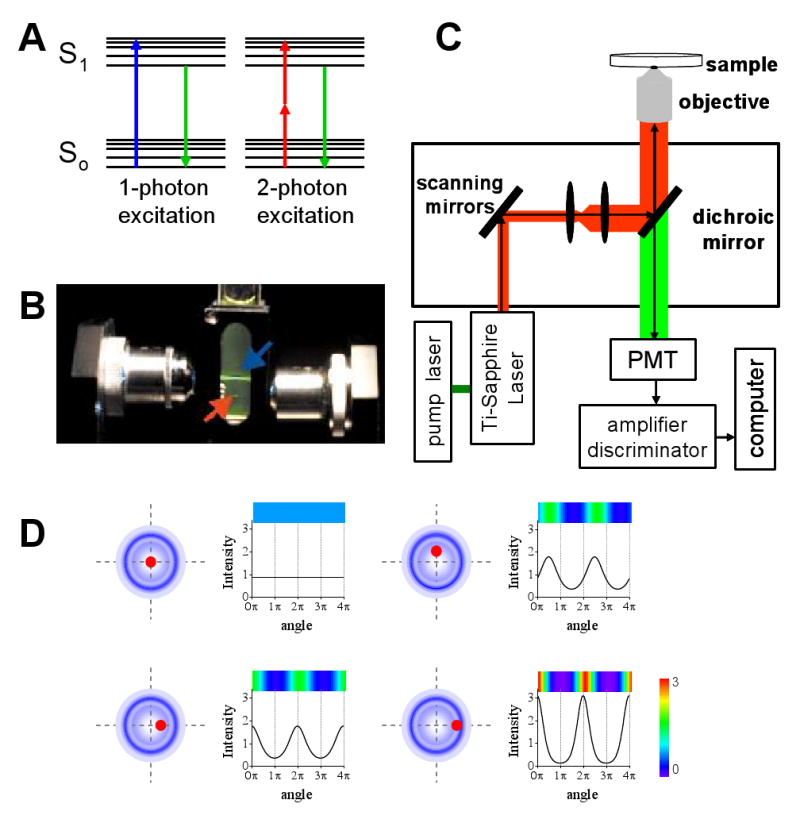
FIGURE 2. Two-photon microscopy.

A. Energy diagrams showing the electronic transitions occurring during one-photon (blue) and two-photon (red) excitation. B Emission volumes obtained in a fluorescein solution excited under one-photon (blue arrow) and two-photon (red arrow) conditions. The numerical apertures of the objectives used in this experiment were the same. C. Scheme of the two-photon excitation microscope used for single particle tracking experiments. D. Intensity profile determined along two cycles of the tracking routine represented as function of the angle of rotation of the laser, for different relative positions of the particle (black dot) with respect to the center of scanning (right panels). The laser orbits are represented with blue circles.
