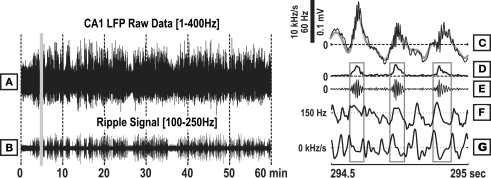
Figure 1.
Illustration of signal processing. (A) LFP recording from stratum oriens of the dorsal CA1 region, sampled at 800 Hz. (B) Bandpass filtered LFP signal between (100–250 Hz) results in typical “ripple” signal. (C) Snapshot of raw LFP data taken from (A) (grey vertical bar), with isolated sharp wave activity in the background (1–25 Hz), (D) ripple signal amplitude envelope, (E) ripple band signal (100–250 Hz), (F) the instantaneous frequency (iFreq) estimate, and (G) the frequency modulation (FM) estimate.

