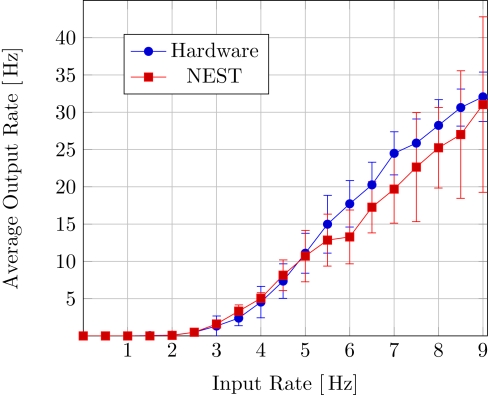
Figure 4.
Average output firing rate of the example network neurons as a function of input rate. The script shown in Listing 1 has been executed with various stimulation rates on both the hardware system (blue circles) and the software simulator NEST (red squares). Each data point represents the mean over 20 runs, the error bars denote the corresponding standard deviations.

