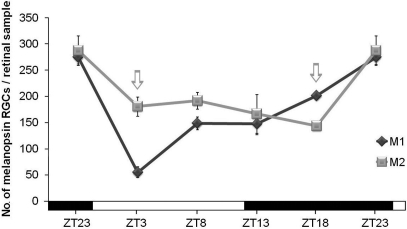
Figure 4.
M1 and M2 cell subpopulations counts under LD conditions. One-way ANOVA tests revealed significant oscillation during the LD cycle for M1 cells (p < 0.001) and for M2 cells (p < 0.01). M1 cells showed a sharp decrease (p < 0.001) at the onset of the light period and then an increase between ZT3 and ZT8 (p < 0.01). For M2 cells, a significant difference was only detected between ZT18 and ZT23 (p < 0.05). Arrows indicate the two time-points in which the numbers of both cell subpopulations were significantly different (p < 0.001 at ZT3 and p < 0.01 at ZT18). (n = 4 per group at all the time-points analyzed).

