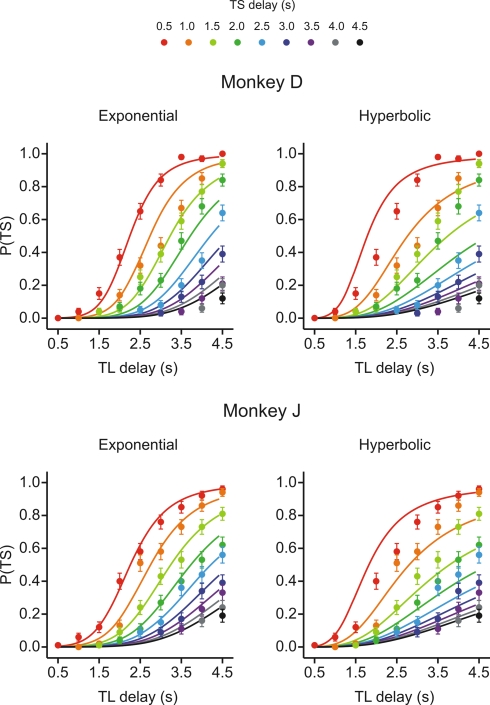
Figure 2.
Choice behaviors in Experiment I-A. Plots show the probability that the animal would choose the small-reward target as a function of the delays for the large-reward (TL) and small-reward (TS) targets, which are indicated in the abscissa and by different colored symbols, respectively. Lines indicate the predictions from the exponential (left) or hyperbolic (right) discount functions. Error bars, SEM.

