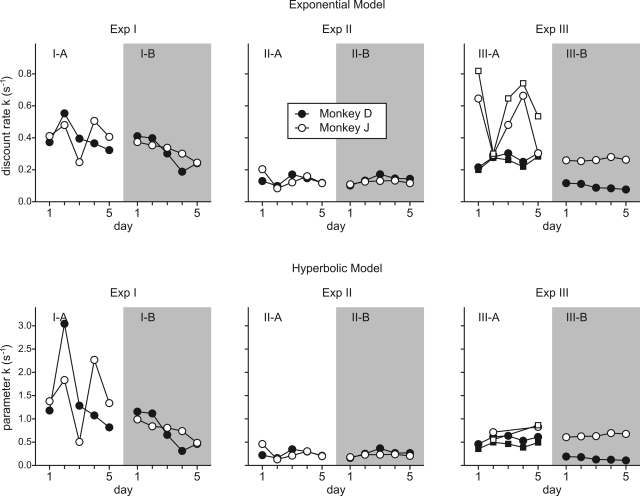
Figure 4.
Daily changes in the parameter k for the exponential (top) and hyperbolic (bottom) discount function. For Experiment III-A, squares indicate the values obtained from the trials in which the clocks did not include any cyan disks. For some sessions during Experiment III-A (monkey J), the model parameters did not converge for the hyperbolic discount function and therefore omitted.

