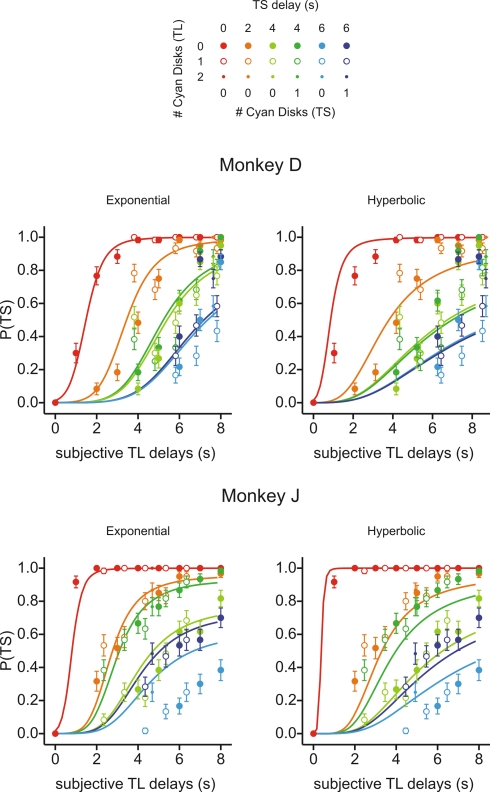
Figure 7.
Choice behaviors in Experiment III-A. The delays for large reward were calculated using the subjective delay for the cyan disk, whereas the physical reward delays and the number of cyan disks used for the small-reward and large-reward targets are indicated by the colors and sizes of the symbols. Lines indicate the predictions from the exponential (left) or hyperbolic (right) discount functions. Error bars, SEM.

