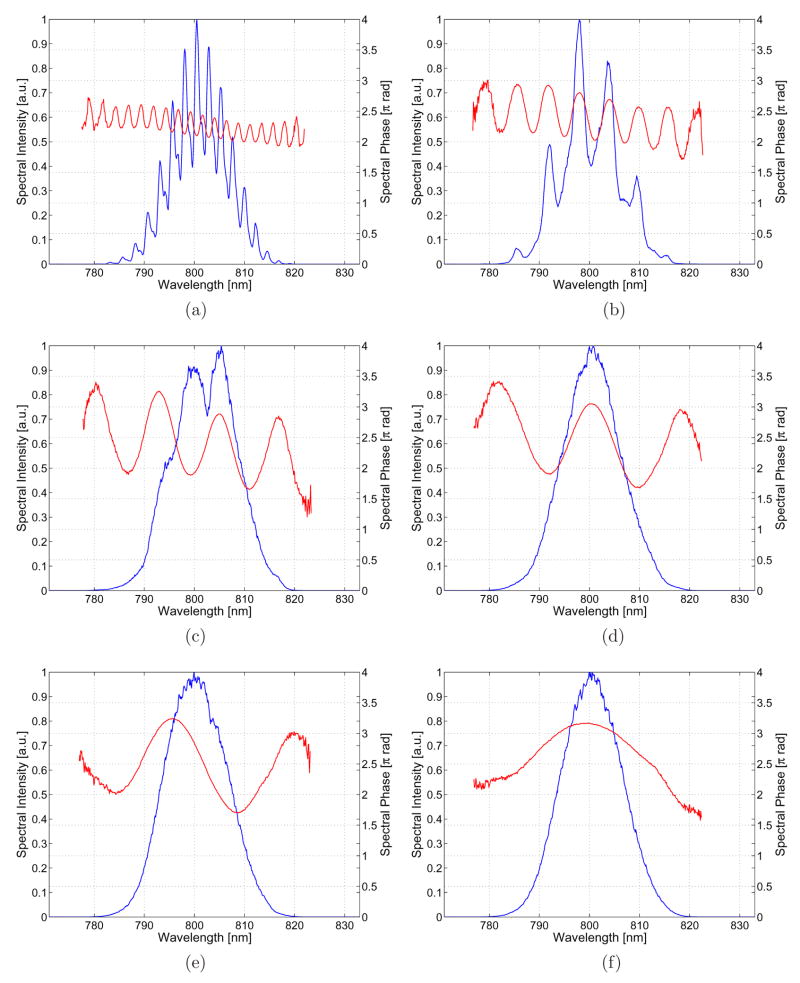
Fig. 9.
This figure illustrates the progression from amplitude and phase modulation to phase-only modulation when the period of a sinusoidal phase written to the SLM is varied. The periods are measured in pixels, and for the figures shown are: (a) 63, (b) 157, (c) 314, (d) 471, (e) 628, and (f) 1256. Note that as the period is decreased, the features on the SLM become smaller than the spectral resolution, resulting in amplitude modulation.

