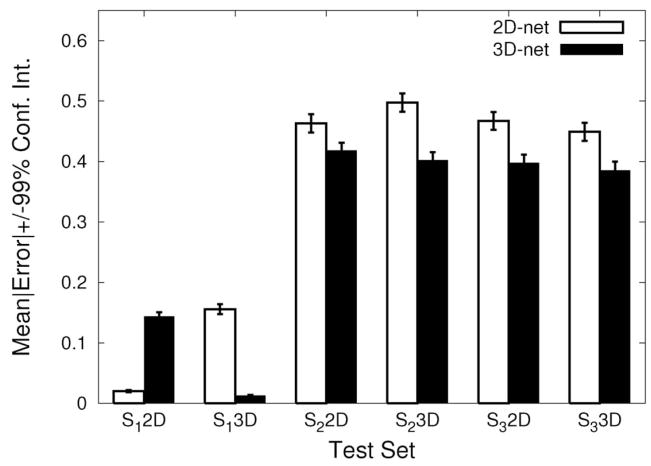
Fig. 10.
Comparison of output errors. The mean error in the output vs. the target value in each trial and its 99% confidence interval (error bars) are shown for all test cases. The same plotting convention was used as in Figure 7. In all cases, the differences between the 3D-net and the 2D-net were significant (t-test: n = 4800, p < 10−8). Note that for the 2D representation of S1, 2D-net < 3D-net.

