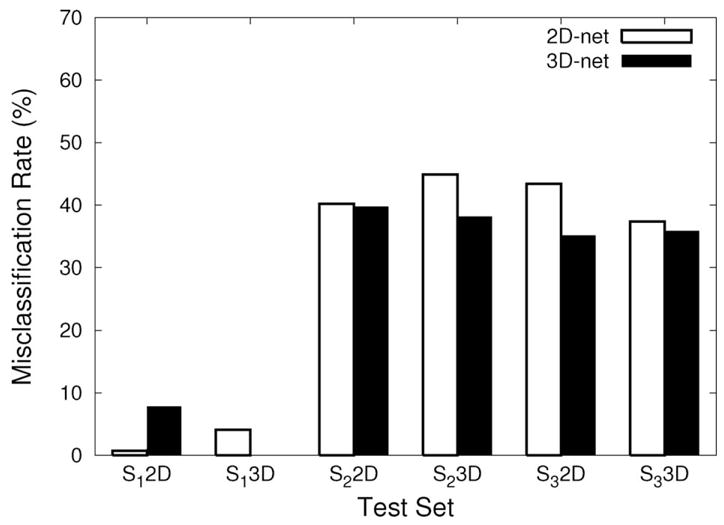
Fig. 7.

Comparison of misclassification rates. The misclassification rates of the different test conditions are shown. Six sets of experiments are shown (indicated under the x axis), each conducted on test examples generated from one of the data sets S1, S2, or S3, using either a 2D- or a 3D representation (3 × 2 = 6 test input sets). For example, “S1 2D” means the 2D representation for the S1 data set. Each test input set was used to evaluate the 2D-net (white bars) and the 3D-net (black bars) trained on S1. In all cases, the 3D-net shows a lower misclassification rate compared to that of the 2D-net, except for the 2D representation of S1 (S1 2D). (See the text for the interpretation of the results.)
