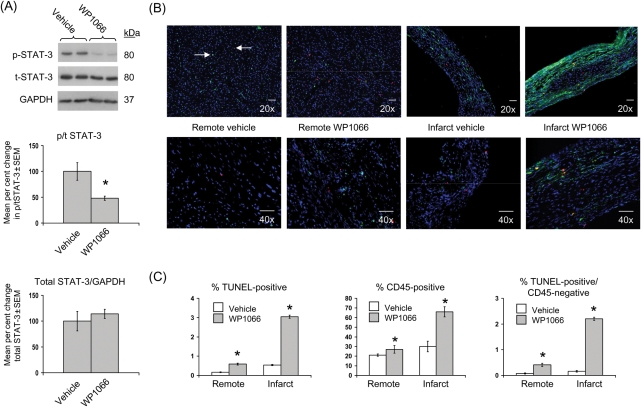
Figure 5.
Inhibition of STAT-3 post-coronary artery ligation increases cardiac apoptosis and inflammation. Data for bar graphs are expressed as per cent changes in mean values ± SEM relative to vehicle-treated mice, which were arbitrarily assigned a value of 100% after statistical calculations were performed. *P < 0.05 relative to vehicle-treated mice. (A) Per cent change in cardiac phosphorylated (p)/total (t) STAT-3 (top graph) and total STAT-3/GAPDH (bottom graph) with representative western blots is shown. (B) Representative ×20 and ×40 power immunofluorescent staining of cardiac sections from remote and infarcted tissue in vehicle- and WP1066-treated mice. Nuclei (stained with DAPI) are shown in blue, an example of a TUNEL-positive cell (left facing arrow) is shown in red, CD45-positive cells are shown in green, an example of a TUNEL/CD45 co-stained cell (right facing arrow) is shown with both red/green staining, and accompanying scale bar (10 µM) is shown in white. (C) Mean ± SEM per cent apoptotic (left panel), CD45-positive (middle panel), and TUNEL-positive/CD45-negative cells (right panel) are shown graphically.

