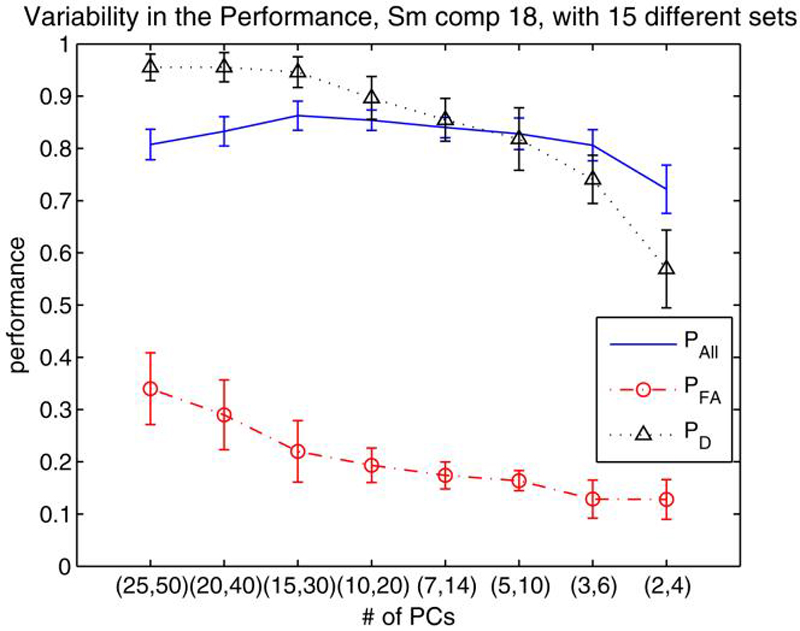
Fig. 7.
Variability in the Performance of SM 18th component with 84 subjects (42 chronic patients, 42 healthy controls). The chronic patient set was kept the same but 15 different healthy control sets were determined (each with different 42 controls) using a total of 56 healthy controls. Variability in PAll, PFA and PD are reported for predicted PFA = 10% threshold. A t-test was employed to eliminate the number of voxels

