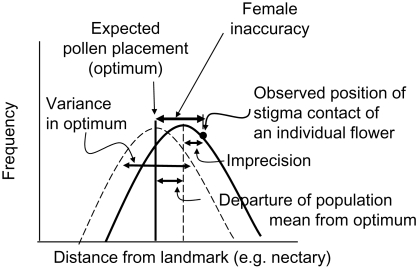
Fig. 2.
A graphical model illustrating female floral accuracy and its components. In this depiction, the optimum (expected location of pollen on the pollinator) also has a variance. Female floral inaccuracy has three components here: (1) the departure of the mean stigma position from the expected location of pollen on the pollinator (as estimated by the mean distance of the anthers from the landmark), (2) variance in the stigma position and (3) variance in the optimum (= variance in the position of the anthers). Very roughly normal distributions were drawn because most morphometric traits tend to have normal distributions.

