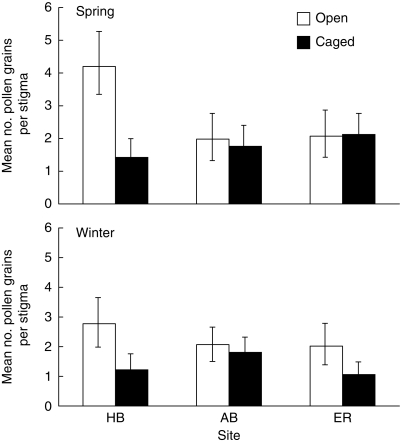
Fig. 3.
Differences among caging treatments at each site and in both seasons in the mean numbers of pollen grains deposited per stigma, after zero inflation was removed. Data are back-transformed after square-root transformation (see Table 1) and error bars represent s.e. The uncaged treatment gave access to both birds and bees; the caged treatment excluded birds but not bees.

