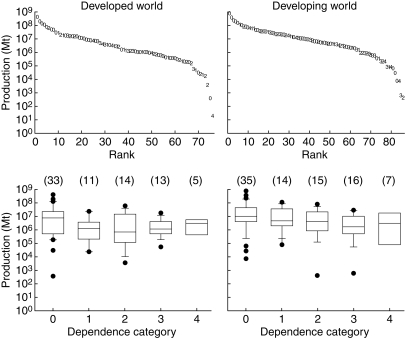
Fig. 2.
Rank abundance curves of crops cultivated in the developed and developing world (upper panels). Crops were ranked from the most to the least abundant according to their total production in each region. Each crop was coded based on its pollinator dependence category (0–4). Crop names are not included for clarity. In the lower panels, crops were grouped according to their pollinator dependence categories and production data summarized as box plots. Sample sizes (i.e. number of crops) are given in parentheses. Note the logarithmic scale of the y-axis in both upper and lower panels.

