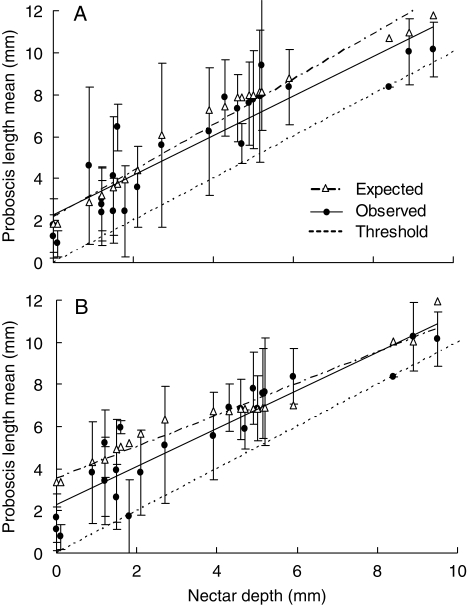
Fig. 2.
Observed and expected proboscis lengths in relation to nectar depths of flowers based on species (A) or individuals (B). Each data point corresponds to a single plant species (n = 25) and is shown as the mean proboscis length of pollinators observed at that plant (filled circles) ±1 s.d. (vertical lines), along with the mean length predicted by the appropriate (species-based or abundance-based) model (open triangles). The threshold line is the line at which proboscis length equals nectar depth.

