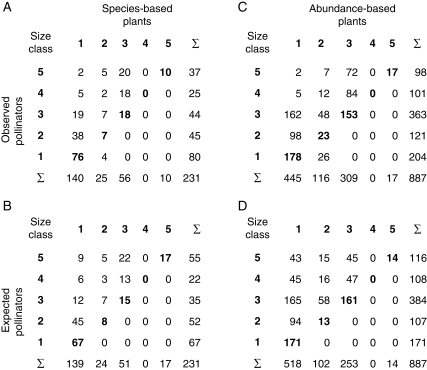
Table 1.
Observed and expected frequency distributions of plant–pollinator interactions across size classes of 2 mm, with pollinators in rows and plants in columns
 |
Size increases from bottom to top (pollinators) and left to right (plants).
Size class 5 for pollinators combines all proboscis lengths between 8 and 14 mm in order to obtain frequencies large enough to meet assumptions of χ2 tests.
