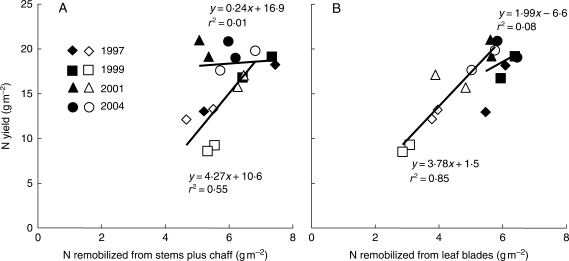
Fig. 3.
Correlation with N yield of N remobilized from stems plus chaff (A) or leaf blades (B) during grain filling. Each point is the mean of three replicates of main shoots extrapolated to the crop level. Years are as indicated; filled symbols represent fungicide-treated crops and open symbols represent diseased crops. Duplicate symbols represent the data for the two late nitrogen fertilization treatments that were applied for each year/disease–control combination.

