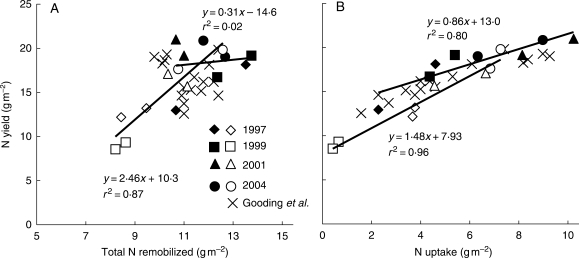
Fig. 4.
Correlation with N yield of total N remobilization (A) and N uptake (B) during grain filling. Years are as indicated; filled symbols represent fungicide-treated crops and open symbols represent diseased crops. Crosses represent data recalculated from Gooding et al. (2005).

