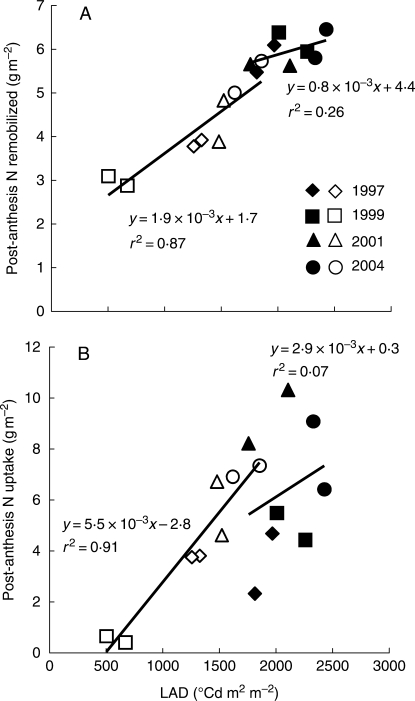
Fig. 5.
Correlations of total leaf area duration (LAD) from anthesis to maturity (as an indicator of leaf disease intensity) with N fluxes in the crops: (A) post-anthesis nitrogen remobilization from leaf blades and (B) post-anthesis nitrogen uptake by the crop. Years are as indicated; filled symbols represent fungicide-treated crops and open symbols represent diseased crops.

