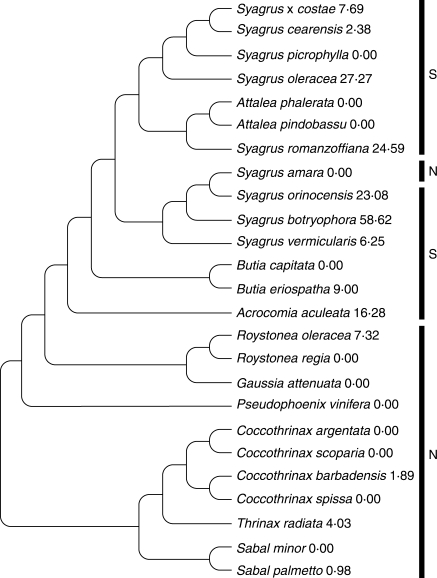
Fig. 3.
Putative relationships among the taxa studied, for testing autocorrelation. Diagram adapted from known phylogenetic information (Nauman and Sanders, 1991; Gunn, 2004; Asmussen et al., 2006; A. W. Meerow, USDA-ARS, USA, unpubl. res.; L. R. Noblick, unpubl. res.). Numbers after taxa are percentage mortality data. Bars to the right indicate the biogeographic group: N = north of 10°N latitude; S = south of 10°N latitude.

