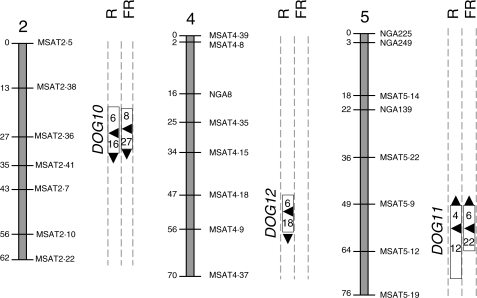
Fig. 2.
QTL mapping for the induction of seed germination by a R or FR pulse in the Bay-0 × Sha RIL population. Seeds were stored at 25 °C for 90 d and then incubated for 3 d at 7 °C, followed by a pulse of R or FR. Only linkage groups with significant QTLs are shown. The arrowheads outside the rectangles show the allelic effects of each QTL: the arrowheads point upwards when the Bay alleles increased the average value of the trait and downwards when the Sha alleles increased the average value of the trait. For other details see Fig. 1.

