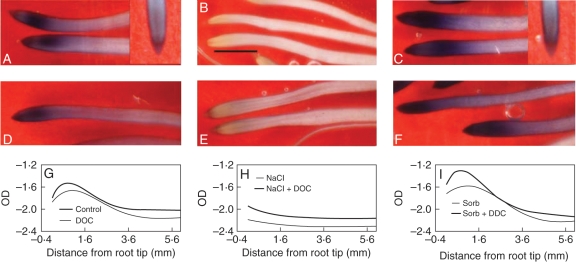
Fig. 2.
Effect of a 3-h NaCl (150 mm) or sorbitol (300 mm) treatment on O2•− levels in root tips. (A–F) NBT staining in those roots; (A, D, G) non-stressed controls; (B, E, H) NaCl treatment; (C, F, I) sorbitol treatment. (D–F) Roots treated with 1 mm DDC to inhibit SOD activity. The inset image in (A) is a control with 10 mm MnCl2, and the inset in (C) is a root treated with sorbitol + 50 µm DPI. Scale bar in (B) = 2 mm. (G–I) Densitometry measurements of stain intensity; curves are fitted with sixth-order polynomials on average measurements, n = 5.

