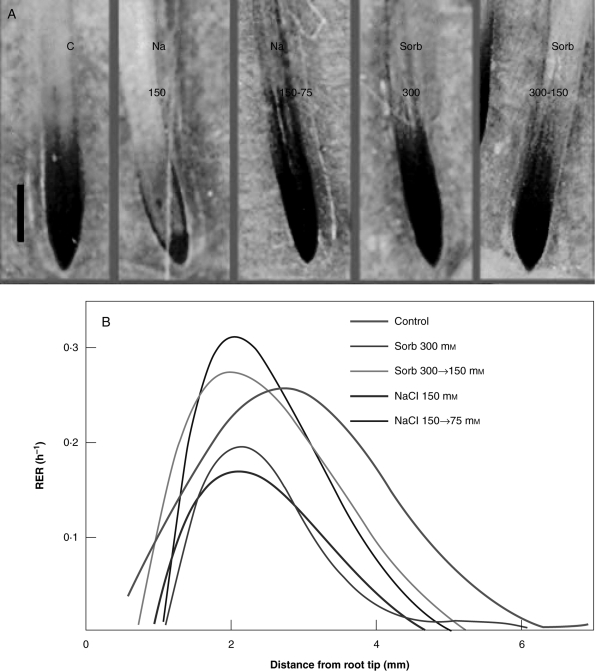
Fig. 5.
(A) NBT staining and (B) segmental elongation rates in stress-relief experiments. Plants were grown in Hoagland solution for 4 d and gradually treated with either 150 mm NaCl or 300 mm sorbitol; elongation rates were measured on day 6, before and after transfer to a hypo-osmotic medium (from 150 to 75 mm NaCl, or from 300 to 150 mm sorbitol); C indicates roots from non-stressed plants. Scale bar = 1 mm. (B) Segmental elongation rates measured immediately before and during the period following stress relief, both for 3 h. RER for each segment is plotted against the initial position of the mark on the root closest to the apex. Data are from 4–8 roots from each treatment and were fitted with sixth- or seventh-order polynomials.

