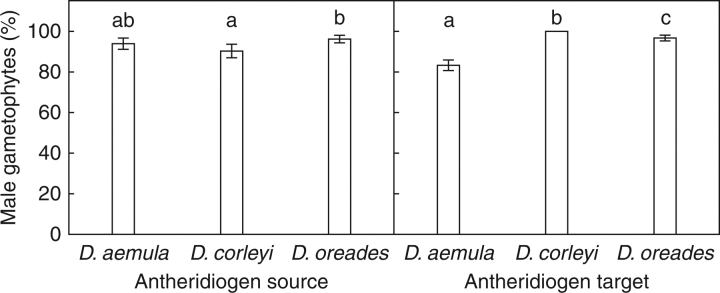
Fig. 2.
Means (± s.e.) of the percentages of male gametophytes with different antheridiogen-source and antheridiogen-target Dryopteris species. Percentages were calculated on the basis of the four trays (n = 4) per antheridiogen source–target combination. Within each graph, different letters indicate significantly different means (P < 0·05, Tukey tests).

