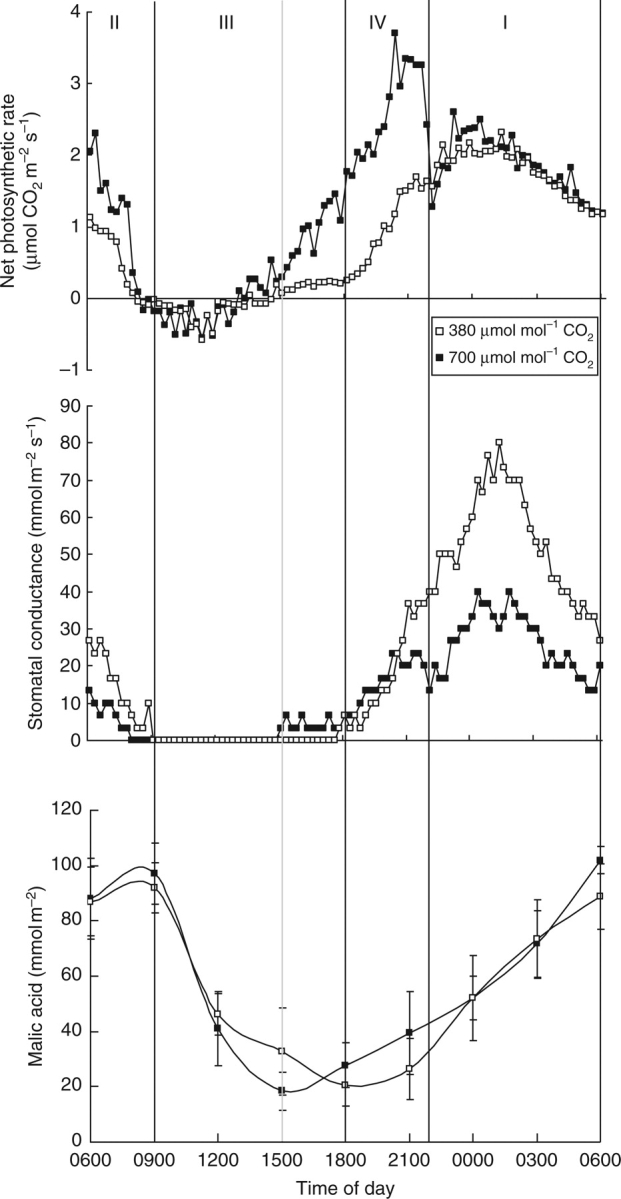
Fig. 1.

Net 24 h CO2 uptake (μmol m−2s−1), diel stomatal conductance (mmol m−2 s−1) and diel malic acid (mmol m−2) pattern for young fully expanded leaves of Aechmea ‘Maya’ at ambient (380 µmol mol−1) and elevated (700 µmol mol−1) CO2. Gas exchange curves are representative of five replicate runs with s.e. <10 %. Malic acid data are means ± s.e. (n = 10 plants). The four different phases of CAM are indicated and the grey line shows a phase shift caused by CO2 elevation.
