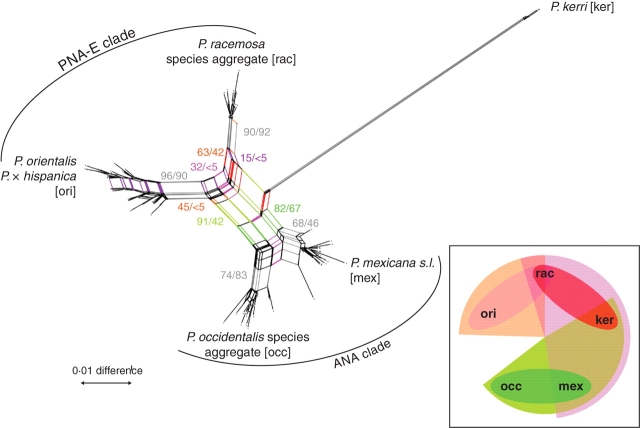
Fig. 4.
NN splits graph based on uncorrected p-distances inferred from the original data; only non-pseudogenous data are included (matrix OMred). Support (BSNN, based on 1000 replicates/BSML of potential nodes in an ML tree) is indicated for the competing central edges (coloured). Inlet, a ‘splits rose’ illustrating the competing relationships. Note the pink semicircle corresponding to the pink-shared edges in the splits graph that interconnects all major groups in Platanus.

