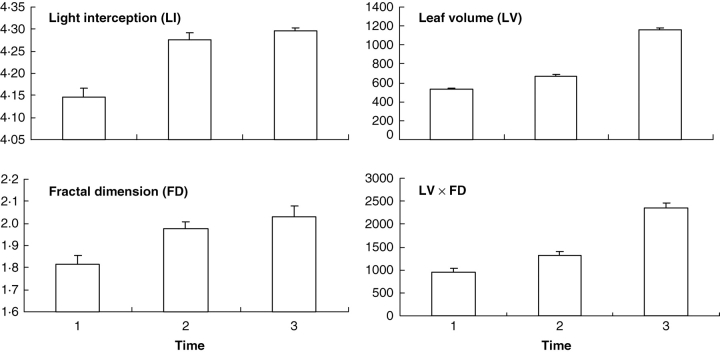
Fig. 3.
Mean values (with standard error bars) at the three times of CT scanning for the variable to explain (LI, or logarithm of the proportion of intercepted light expressed as a percentage; Purcell, 2000) and the three candidate explanatory variables used separately in variants of the three-dimensional version of the Beer–Lambert law. Variables LI and FD are unit-less, while LV and LV*FD are in cubic millimetres.

