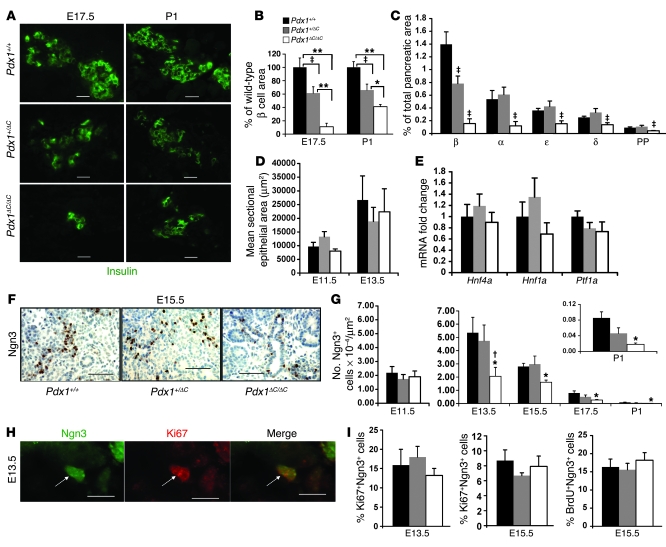
Figure 4. Specific defect in endocrine progenitor specification in Pdx1ΔC/ΔC mice.
(A–C) Global reduction in endocrine lineages at E17.5 in Pdx1ΔC/ΔC mice. (A) Immunofluorescence for insulin (green). Scale bar: 20 μm. (B) Pancreatic area occupied by insulin-positive β cells. Values are expressed relative to wild-type mice (n = 5–9 per genotype; *P < 0.05, **P < 0.0005, ‡P < 0.05). (C) Percentage pancreatic area at E17.5 occupied by the 5 endocrine cell types (n = 6–8 animals per genotype, 3 sections per animal; ‡P < 0.05 compared with both other groups). PP, pancreatic polypeptide. (D and E) Normal epithelial area in Pdx1ΔC/ΔC mice. (D) Pancreatic epithelial area measured from 3 (E13.5) or 5 (E11.5) H&E-stained sections. (E) Relative mRNA levels of Hnf1a, Hnf4a, and Ptf1a in E13.5 pancreas (n = 7–9 per genotype). (F and G) Reduction in Ngn3+ pancreatic endocrine progenitor cells in Pdx1ΔC/ΔC mice. (F) Immunostaining for Ngn3 (brown) with hematoxylin counterstain (blue). Scale bar: 50 μm. (G) Number of Ngn3+ cells per unit of epithelial area (E11.5) or pancreatic area (E13.5–P1) quantified from 3 (E13.5–P1) or 5 (E11.5) tissue sections per animal (n = 4–8 per genotype; *P < 0.05 compared with wild-type mice; †P < 0.05 compared with Pdx1+/ΔC mice). (H and I) Ngn3+ endocrine progenitors replicate normally in Pdx1ΔC/ΔC mice. (H) Representative example of Ki67+Ngn3+ double-positive cell. Arrows point to the same cell in all panels. Scale bar: 10 μm. (I) Percentage of total Ngn3+ cells that are Ki67+ or BrdU+; more than 100 Ngn3+ cells per animal were counted (n = 4–5 per genotype).

