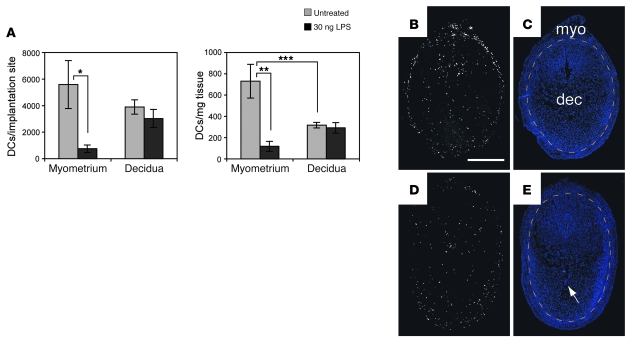
Figure 8. LPS fails to induce DC emigration from the decidua.
E6.5 pregnant mice remained untreated or were injected intravenously with 30 ng LPS. (A) Flow cytometry–based quantification of DC cell numbers per implantation site and DC tissue densities 28 hours after injection. DCs were enumerated as MHCII+F4/80–CD11chi cells. The data show mean ± SEM for n = 6 mice per group. *P = 0.02, **P = 0.004, ***P = 0.03. We obtained the same results when we considered each DC subset individually (data not shown). (B–E) Spatial distribution of DCs in implantation sites of untreated (B and C) and LPS-treated (D and E) mice 28 hours after injection. Transverse sections were double stained with anti-MHCII and anti-CD11c antibodies. (B and D) Combined images after their “AND” gating (i.e., Double+ cells as in Figure 5). (C and D) DAPI counterstaining. Orange dashed lines demarcate the decidua from the myometrium. The arrow indicates an implanted embryo. To visualize DCs in panoramic view, the images were manipulated as described in Methods. Scale bar: 1 mm. Data are representative of n = 3–5 mice per group.

