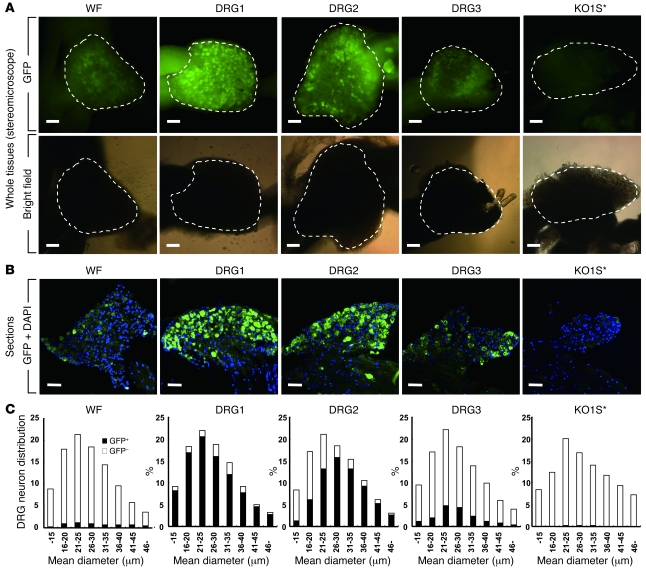
Figure 3. Histological analysis of GFP expression in DRG neurons after transduction with DRG-targeting HDAd vectors.
(A) GFP expression in whole DRG tissues. Shown are images under GFP filter and bright filter. Dashed lines denote the margin of DRG tissues. (B) DRG sections with DAPI nuclear stain. (C) Distribution of GFP-positive DRG neurons in each 5 μm of mean diameter. Scale bars: 100 μm.

