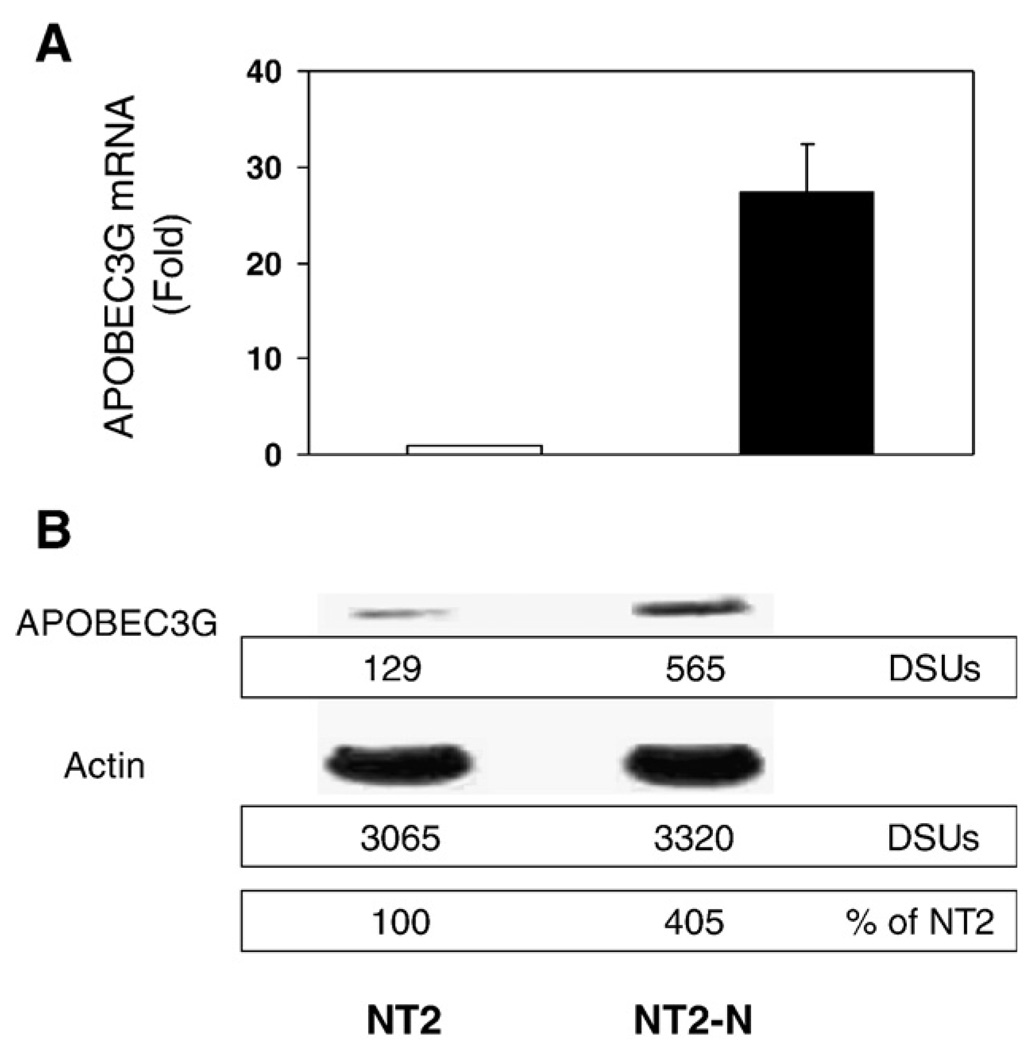
Fig. 2.
APOBEC3G expression in undifferentiated NT2 and differentiated NT2-N cells. (A) Real time RT-PCR analysis of expression of APOBEC3G mRNA. Total cellular RNA was extracted from NT2 and NT2-N cells (5-week retinoic acid [RA] -treated NT2 cells), and subjected to the real time RT-PCR using the specific primer pairs for APOBEC3G. The data is expressed as mean±SD of three independent experiments. (B) Western blot analysis of APOBEC3G protein expression. Equal amount of proteins extracted from undifferentiated NT2 cells and NT2-N cells was subjected to Western blot assay using rabbit antibodies against APOPEC3G and actin. The panels show the signal intensities (densitometry scanning units, DSUs) of protein bands of the Western blot. One representative of 3 independent experiments with similar data is shown.

