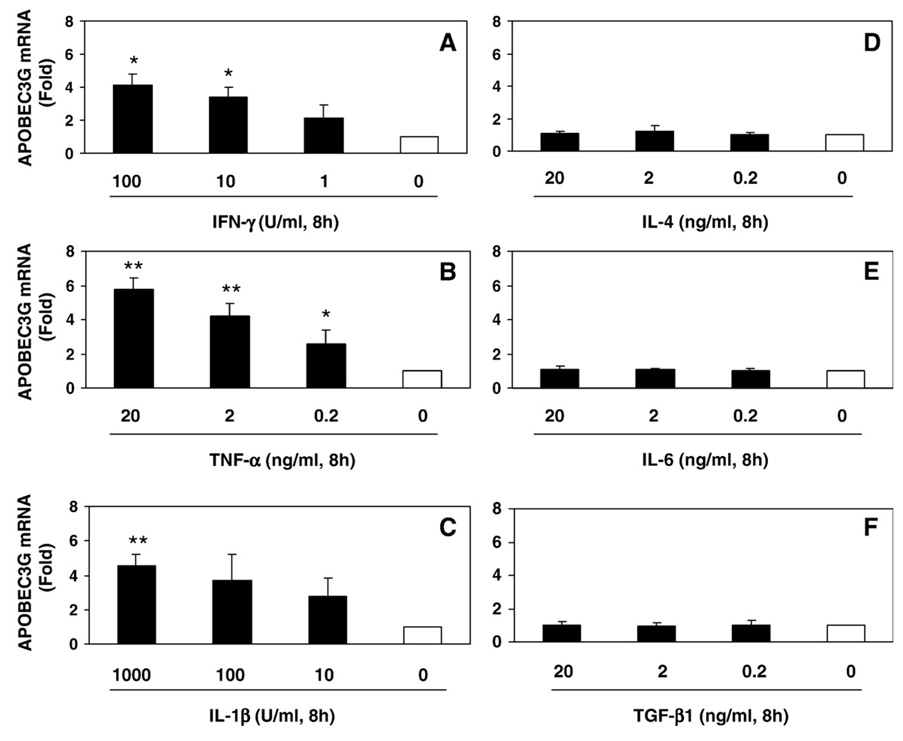
Fig. 4.
Effects of cytokines on APOBEC3G expression in NT2-N cells. NT2-N cells were treated with IFN-γ (A), TNF-α (B), IL-1β (C), IL-4 (D), IL-6 (E) and TGF-β1 (F) at the indicated concentrations for 8 h. Total cellular RNA was subjected to the real-time RT-PCR for APOBEC3G mRNA, which is expressed as fold increase over untreated NT2-N cells (defined as 1). The data is expressed as mean±SD of triplicate cultures, representative of three independent experiments (*, p<0.01; **, p<0.001; treated by indicated cytokines vs. untreated).

