
Fig. 3.
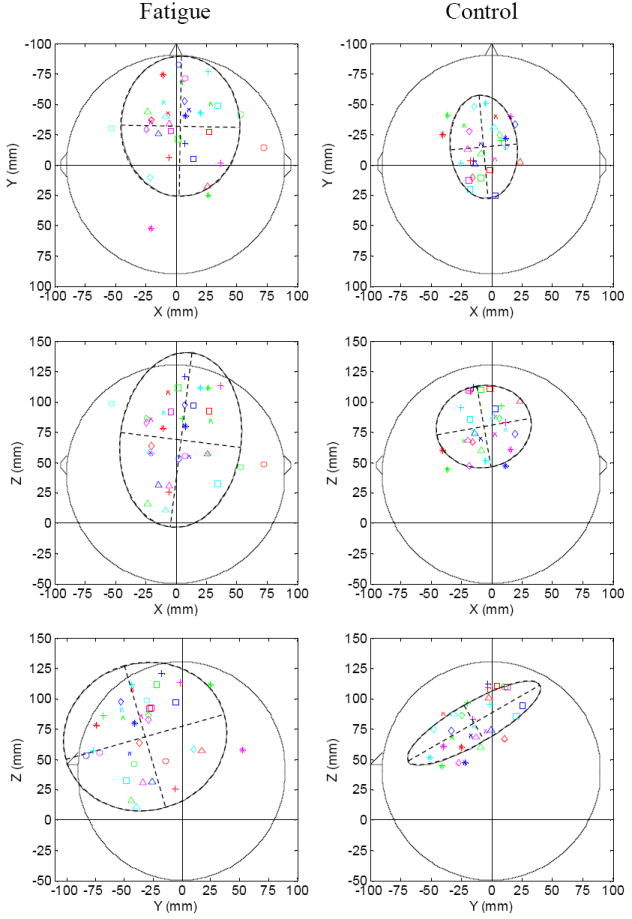
Single dipole plots showing locations of the center of brain activation. The locations of the moving dipoles are plotted in the X-Y (top row, top view), X-Z (middle row, back view), and Y-Z (bottom row, side view) planes. X: left to right; Y: front to back; Z: bottom to top. The triangles in the top and middle rows indicate the position of the nose, and positions of the ears are marked on two sides of each circle in the top and middle rows. In each plot, each subject is represented by a symbol, and each contraction block is represented by a color (block 1: dark blue; block 2: red; block 3: green; block 4: magenta; block 5: light blue). The ellipse in each plot represents the 95% confidence region that contains 95% of the data points in the data set. The dipole locations show much greater spatial dispersions for the fatigue (left column) than non-fatigue (right column) conditions. The centers (indicated by the cross points of the dashed straight lines) of the ellipses in the fatigue condition are located more toward the right hemisphere, anterior and inferior regions of the brain.