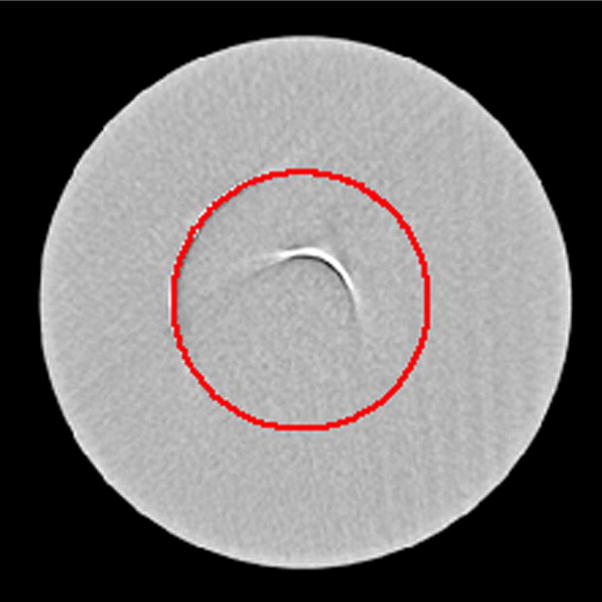
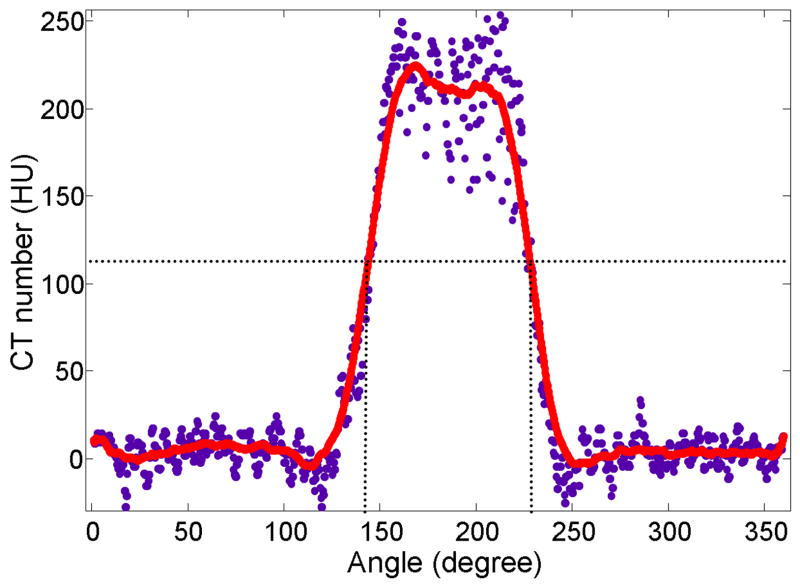
Figure 5.
Demonstration of the method used to measure the angular extent of the partial ring artifact. a) The image shown in Figure 4a with a circle manually fit to the radius of curvature of the outermost arc. b) Plot of the background-corrected CT number versus angular position of the values underneath the circle overlay (blue data points). A 101-voxel wide sliding average smoothing was performed (red line) to reduce the influence on noise. The FWHM of the smoothed profile was used to quantitate the temporal resolution of the associated scan mode.


