Fig.5.

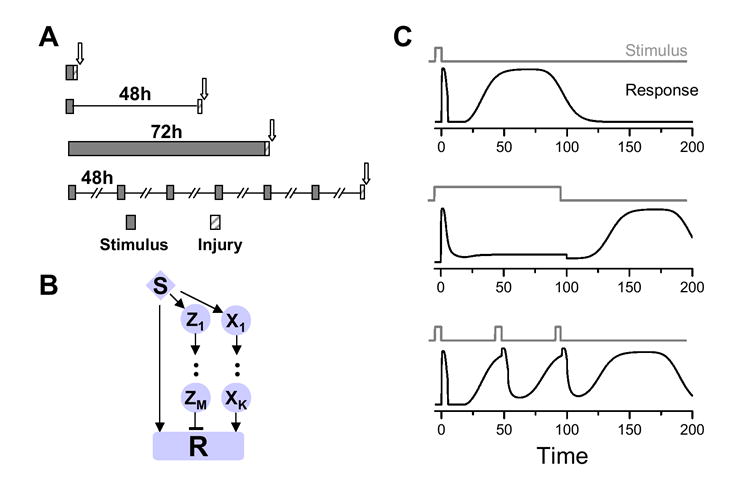
A. Schematic representation of experimental data from cardiac protection studies. Scale is approximate; arrow indicated time point of analysis. B. Signaling module composed of positive feedforward motif and a negative feedforward motif as one potential representation of the module driving the experimental behavior in A. C. Response of signaling module in B to different stimuli.
