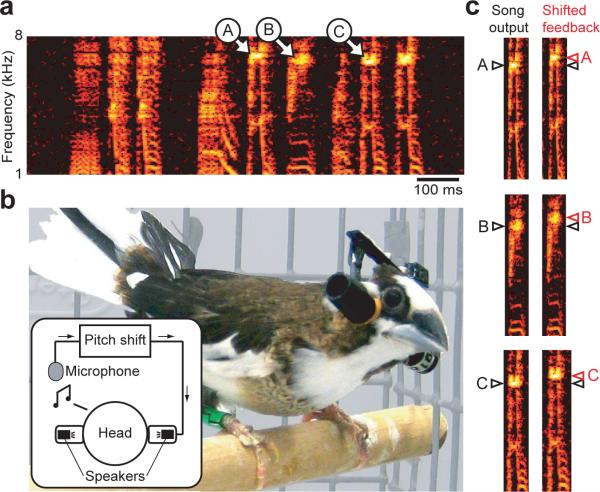
Figure 1. Technique for manipulating auditory feedback.
a, Crystallized song from an adult Bengalese finch. Spectrographic representation shows the power at each frequency (color scale) as a function of time. Three harmonic features are labeled A, B, and C. b, Each bird was fit with a set of headphones that housed a pair of speakers. A microphone in the cage (see inset) provided input to online sound-processing hardware, which was used to manipulate the pitch of song. Processed acoustic signals were then relayed to the headphone speakers via a flexible cable (not shown in photograph) and played through the speakers. c, An upward (+100 cent) shift in the pitch of auditory feedback introduced by the headphone system. For each of the harmonic features labeled in (a), the left spectrogram shows the bird's acoustic output and the black triangle shows the frequency of the harmonic feature. The right spectrogram shows the pitch-shifted auditory feedback played through the headphones and the red triangle shows the frequency of the harmonic feature in the shifted song. Black triangles are repeated next to the spectrograms on the right for comparison.

