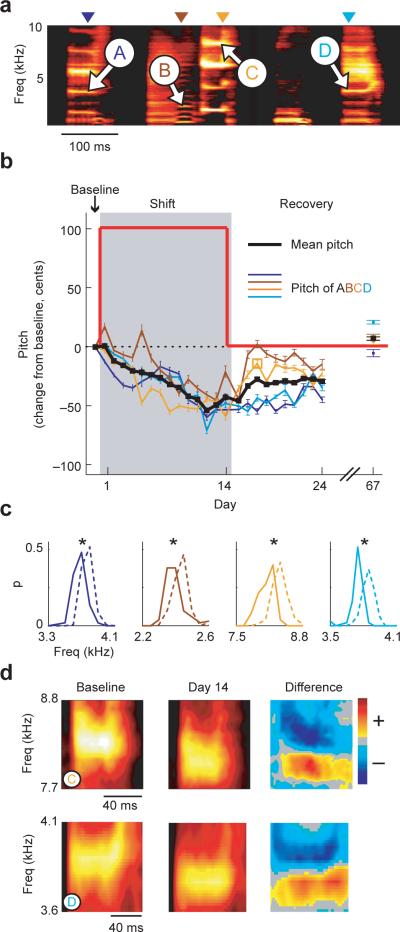
Figure 2. Vocal error correction driven by an upward shift in the pitch of auditory feedback.
a, Baseline song of Bird 1 (mean spectrogram). Arrowheads above the spectrogram indicate the spectral frames (measurement times within each syllable) at which four harmonic features (white arrows labeled A-D) were measured in order to quantify changes in the pitch of song. b, Changes in pitch in response to a 100 cent upward shift (red line) in the pitch of auditory feedback and subsequent recovery back to baseline. Colored lines show the mean +/− s.e.m. change in pitch (measured in cents, see Methods) of each harmonic feature across time, and the black line shows the mean change in the pitch of song (mean +/− s.e.m. pitch change averaged across harmonic features). After 14 days of shift exposure (gray box), unshifted auditory feedback was restored and the bird was monitored for an additional 10 days. Pitch was also measured on day 67 in order to assess any long-term changes. c, Pre- and post-shift distributions of the frequencies of the harmonic features shown in (a). For each feature, the probability distribution of frequencies during baseline (dashed lines) and day 14 (solid lines) differed significantly (asterisks indicate p<10−5, 1-tailed t-test). Color conventions for each feature as in (b). d, Pitch shift-induced changes in mean spectral structure. Left, mean spectrograms for harmonic features C (top) and D (bottom) during the baseline epoch. Middle, mean spectrograms for features C and D on shift day 14. Right, difference spectrograms obtained by subtracting the baseline spectrograms from the day 14 spectrograms.

