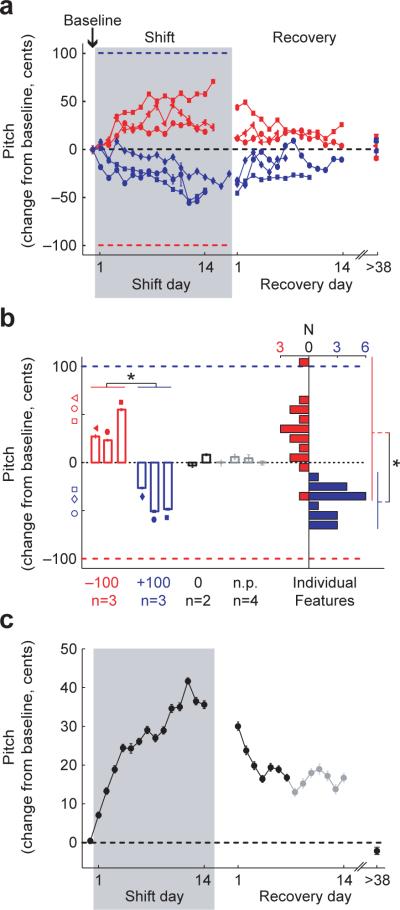
Figure 3. Error correction in response to upward and downward shifts in feedback pitch.
a, Mean +/− s.e.m. changes in the pitch of song (across harmonic features) as a function of time for 3 experiments with downward shifts in feedback pitch (−100 cents, red) and 3 experiments with upward shifts (+100 cents, blue). “Recovery day 1” is the first day after unshifted feedback was restored. Symbol shapes identify individual birds. Other conventions as in Figure 2b. b, Mean +/− s.e.m. change in song pitch during shift days 12−14 for downward (empty red bars) and upward (empty blue bars) shifts of auditory feedback. Symbols identify individual birds as in (a). Empty red and blue symbols at left indicate the magnitude of one s.d. of pitch variation in the baseline epoch of each experiment (averaged across harmonic features). Black bars show changes in song pitch across the same interval in birds that wore headphones but did not experience pitch shifts (“0 shift”), and gray bars show the same measure in a group of birds that did not wear headphones at all (“no phones,” or “n.p.”). Longitudinal data from the two 0 shift birds is available as Supplementary Figure 6 online. Filled bars at right show the distribution of pitch changes for individual harmonic features, combined across all downward (red) and upward (blue) shifts of auditory feedback. Asterisks indicate significant differences between the effects of upward and downward shifts (p<0.05, 1-tailed t-tests). Additionally, the changes in song pitch in each +/−100 cent shift group were significantly different from changes in both of the control groups (p<0.05 in all cases, 1-tailed t-tests). c, Combined data from all experiments, reoriented so that changes in the adaptive directions are positive. Days from which data were available from all 6 experiments are plotted in black, recovery days from which data are available from a subset of 4 experiments are plotted in gray.

