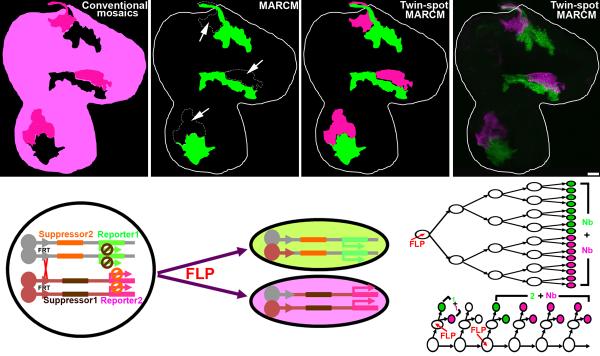
Figure 1. Evolution of mosaic techniques and the twin-spot MARCM design.
Comparison of expected clone patterns from various mitotic recombination-based mosaic systems [conventional mosaics (a), MARCM (b), and twin-spot MARCM (c)] to actual twin-spot MARCM clones in a 3rd instar wing disc (d). (a) In conventional mosaic analysis, clones of interest with the homozygous genotype are invisible (shown in black). The reference clones (dark magenta) are intermingled with the background (light magenta). (b) In MARCM, clones of interest with the homozygous genotype (shown in green) stand out from the unlabeled background (black) and the reference clones (arrows). (c and d) In twin-spot MARCM, clones of interest and the reference clones with homozygous genotypes are visible in green and magenta, respectively, and stand out clearly from the unlabeled background (black). (e) In the twin-spot MARCM system, “suppressor 1” (which inhibits the expression of “reporter 1”) and “reporter 2” are placed distal to one FRT site, while “suppressor 2” (which inhibits the expression of “reporter 2”) and “reporter 1” are placed distal to the other FRT site. After induction of FLP to activate FRT-mediated mitotic recombination, one daughter cell (green) inherits “suppressor 2” and “reporter 1”, while the other (magenta) gets “suppressor 1” and “reporter 2”. A lineage undergoing symmetric (f) or asymmetric (g) proliferation will produce two multi-cellular clones (f) or a two-cell + multi-cellular clone (g). Two single-cell clones (g) appear, one in green and the other magenta, when mitotic recombination occurs during last mitoses (as in a GMC). The scale bar in this and all other figures equals 20 μm.

