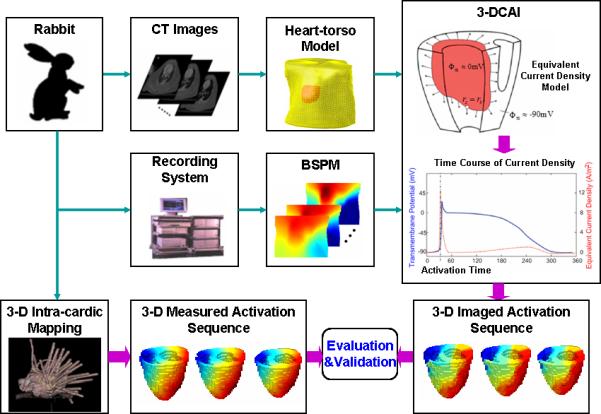
Fig. 2.

Schematic diagram of the experimental protocol. Simultaneous 3-dimentional (3-D) intra-cardiac mapping and body surface potential mapping were conducted and the measured activation sequence from 3-D intra-cardiac mapping is compared with the imaged activation sequence obtained by the 3-D cardiac activation imaging technique.
