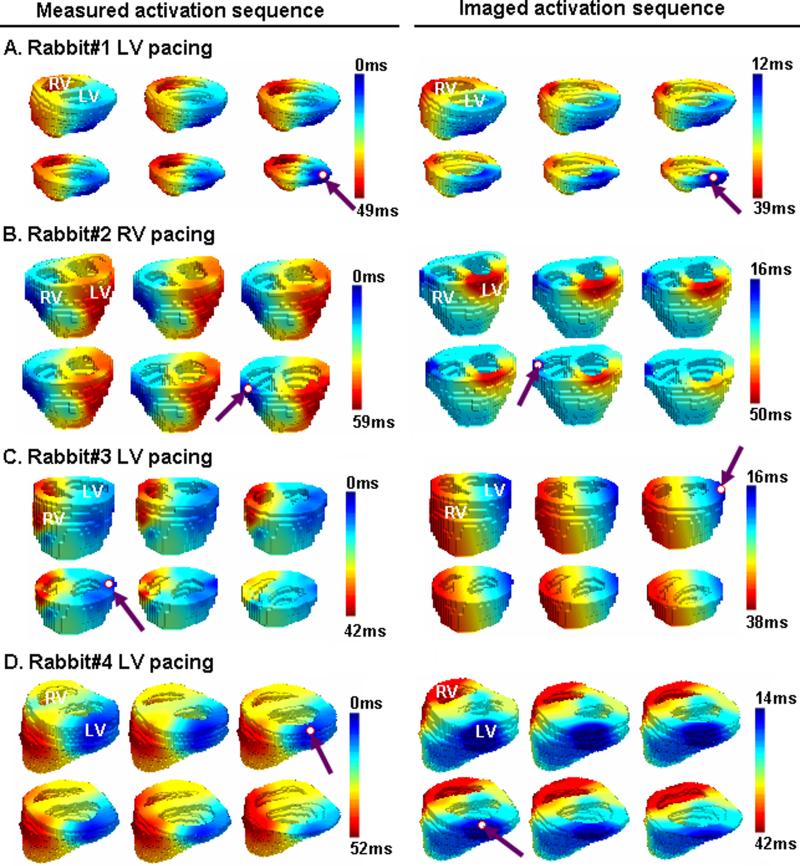
Fig. 4.
Comparison between the 3-D activation sequence measured via 3-D intra-cardiac mapping (left column) and the 3-D activation sequence imaged by using 3-DCAI (right column). The activation sequence is color coded from blue to red, corresponding to earliest and latest activation. The pacing site and the estimated initial site of activation are marked by a red circle and a purple arrow. (A) Activation was paced at left posterior wall of ventricle in rabbit 1. A realistic geometry of ventricle for rabbit 1 is displayed (top left view). (B) Activation was induced by pacing at right lateral wall of ventricle in rabbit 2 (top anterior view). (C) Activation was induced by pacing at left lateral wall of ventricle in rabbit 3 (top anterior view). (D) Activation was induced by pacing at left lateral wall of ventricle in rabbit 4 (top left view).

