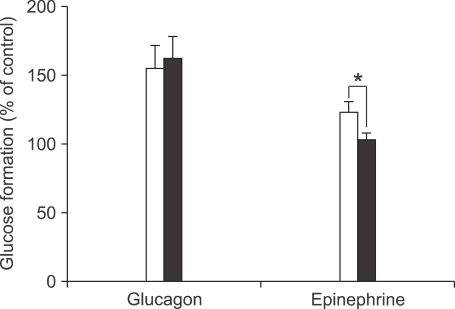
Figure 2.
Glucose formation in response to epinephrine in young and old rat primary hepatocytes is different, unlike the response to glucogan. Glucose formation measured after 10 nM glucagon and 10 µM epinephrine treatments in young and old rat primary hepatocytes after a 6 h incubation with glucose formation buffer using the enzymatic method. Values were normalized with the total protein concentration and are shown as a percentage of the control after glucagon and epinephrine treatments. Data represent mean ± S.E. from three separate duplicated experiments. An open square represents values from young (4 month) rat hepatocytes and a black square represents values from old (24 month) rat hepatocytes. An asterisk *indicates a statistically significant difference (P < 0.05) based on a two-tailed Student's t-test.

