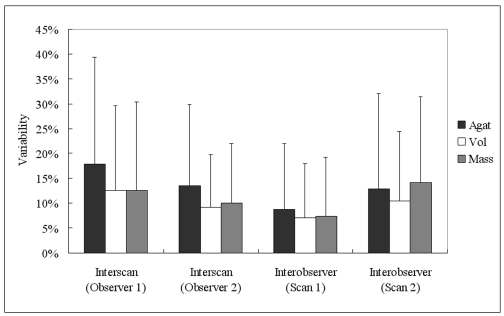
Fig. 3.
Interscan and interobserver variability of Agatston, volume, and mass scores.
Graph shows interscan and interobserver variability (Agatston; black, volume; white, mass; gray). Bars and vertical lines indicate mean and standard deviation, respectively. Interscan variability was different between scoring algorithms (p < 0.05) and observers (p < 0.05). Mean variability values are referenced in text.

