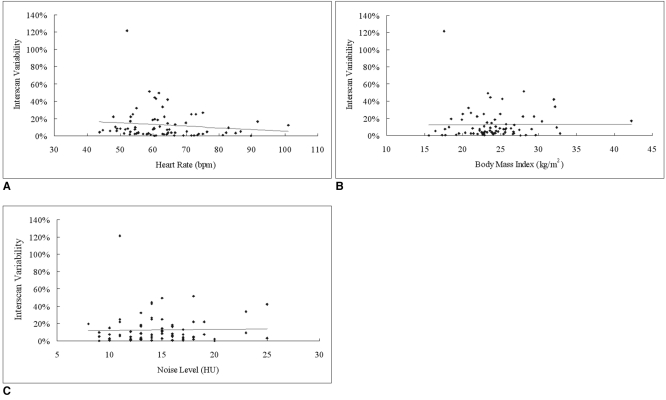
Fig. 4.
Scatterplots show ratio (A) between heart rate (bpm) and interscan variability: r2 = 0.016, slope = -0.002 /bpm, intersection = 25%, p = 0.27 ratio (B) between body mass index (kg/m2) and interscan variability: r2 < 0.001, slope = 0.0003 /kg per millimeter squared, intersection = 12%, p = 0.94 and ratio (C) between noise level (HU) and interscan variability: r2 = 0.0007, slope = 0.0013 /HU, intersection = 11%, p = 0.82. Exceptional high variability is observed in case with low coronary artery calcium score.

