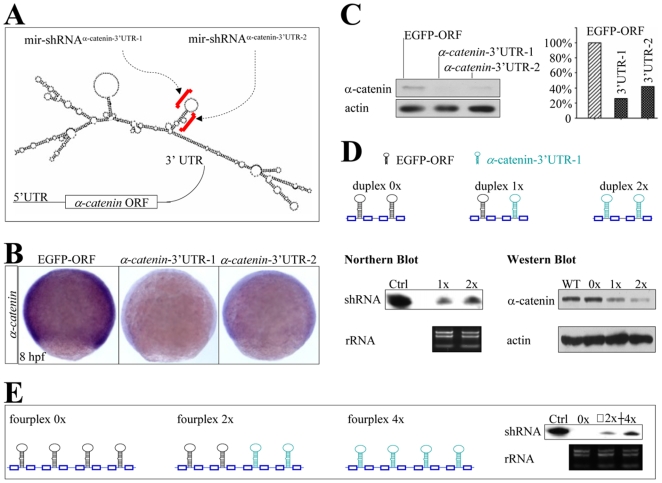
Figure 4. Knockdown of endogenous α-catenin expression.
(A) Diagram of mir-shRNAα-catenin-3′UTR-1 and mir-shRNAα-catenin-3′UTR-2 against the 3′UTR of α-catenin gene, whose predicted secondary structure was shown at the bottom. Red brackets denoted the targeted regions. (B) WISH analysis of α-catenin expression in the 8 hpf embryos injected with 160 pg of either shRNAEGFP-ORF, shRNAα-catenin-3′UTR-1 or shRNAα-catenin-3′UTR-2 mRNAs. (C) Quantitative Western blot analysis of α-catenin protein in 22 hpf embryos injected with shRNAs shown in panels B (5 embryos for each lane). (D) Diagram of mir-shRNA duplexes carrying two copies of shRNAEGFP-ORF (duplex 0×), one copy for each shRNAEGFP-ORF and shRNAα-catenin-3′UTR-1 (duplex 1×), and two copies of shRNAα-catenin-3′UTR-1 (duplex 2×). Northern and Western blot analyses of 22 hpf embryos injected with shRNAs 0×, 1× or 2× as shown at the bottom (100 embryos for each line). The ribosomal 5S RNA and β-actin was used as a loading control, respectively. (E) Diagram of mir-shRNA fourplexes carrying four copies of shRNAEGFP-ORF (0×), two copies for each shRNAEGFP-ORF and shRNAα-catenin-3′UTR-1 (2×), and four copies of shRNAα-catenin-3′UTR-1 (4×). Northern blot analysis of 22 hpf embryos injected with shRNAs 0×, 2× or 4× (100 embryos for each line). The ribosomal RNA was used as a loading control.

