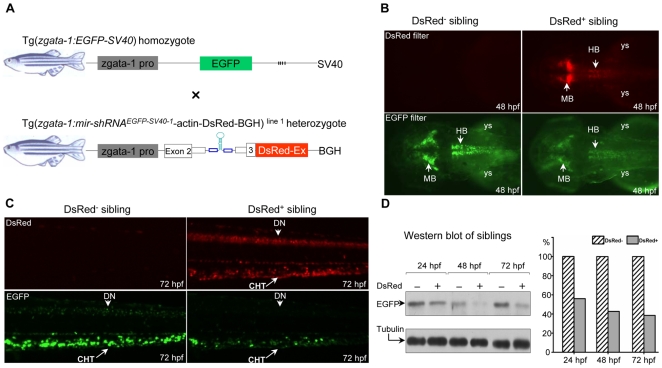
Figure 6. Tissue-specific knockdown of chromosomally integrated EGFP expression.
(A) Diagram of transgenic lines Tg(zgata-1:EGFP-SV40) and Tg(zgata-1:mir-shRNAEGFP-SV40-1-actin-DsRed-BGH) line 1 under control of zebrafish gata-1 promoter. (B) Knockdown of EGFP fluorescence was observed in the mid- and hindbrain of the DsRed+, but not DsRed− F2 sibling at 48 hpf. Embryos are dorsal view with head to the left. (C) Knockdown of EGFP fluorescence was observed in the dorsal neurons and caudal hematopoietic tissue of the DsRed+, but not DsRed− F2 sibling at 72 hpf. MB: midbrain; HB: hindbrain; ys: yolk sac; DN: dorsal neurons; CHT: caudal hematopoietic tissue. Embryos are lateral view with head to the left. (D) Western blot analysis of EGFP expression in the DsRed− and DsRed+ F2 embryos at 24, 48 and 72 hpf. The α-tubulin protein was used as a loading control.

