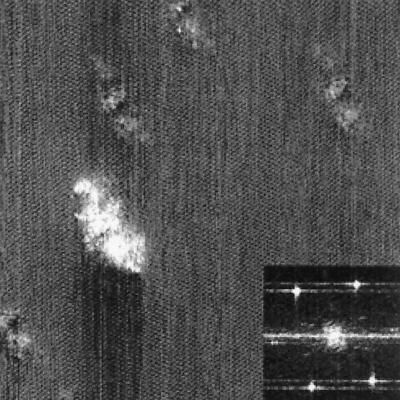
Figure 2.
A constant current topographic image of graphite fluorinated at 250°C imaged with a bare metal STM tip. The differences in defect size correspond to differences in the C–F bonds. (Inset) This image is the corresponding Fourier transform. Although much weaker than in Fig. 1, the six superlattice peaks are still present. The tunneling parameters were 1-nA tunneling current and +100-mV sample bias voltage.

