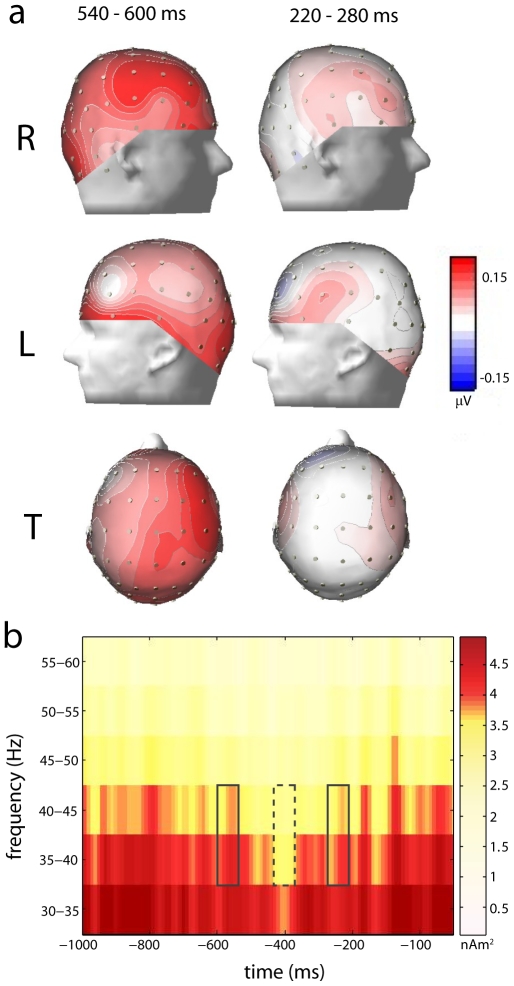
Figure 3.
a) Topography of 35–45 Hz scalp spectral power during the −540 to −600 ms and −220 to −280 ms intervals, relative to the baseline interval, for the (R) right side, (L) left side and (T) top view. b) Periodic bursts of gamma-band scalp activity time-locked to button presses (at 0 ms) indicating perceptual switching. Depicted is gamma-band power averaged across subjects and across the 30 electrodes where gamma activity was most clearly expressed (see Methods). Solid lines denote time-frequency windows used for beamformer source localization; dotted lines denote the baseline.

